Order the Bridge Correctly Before a Waterfall Chart Explains the Wrong Total
Use a technical waterfall chart workflow when the chart is supposed to explain movement, but the real risk is that the steps are grouped, signed, or ordered in a way that tells the wrong story.
Open Waterfall Chart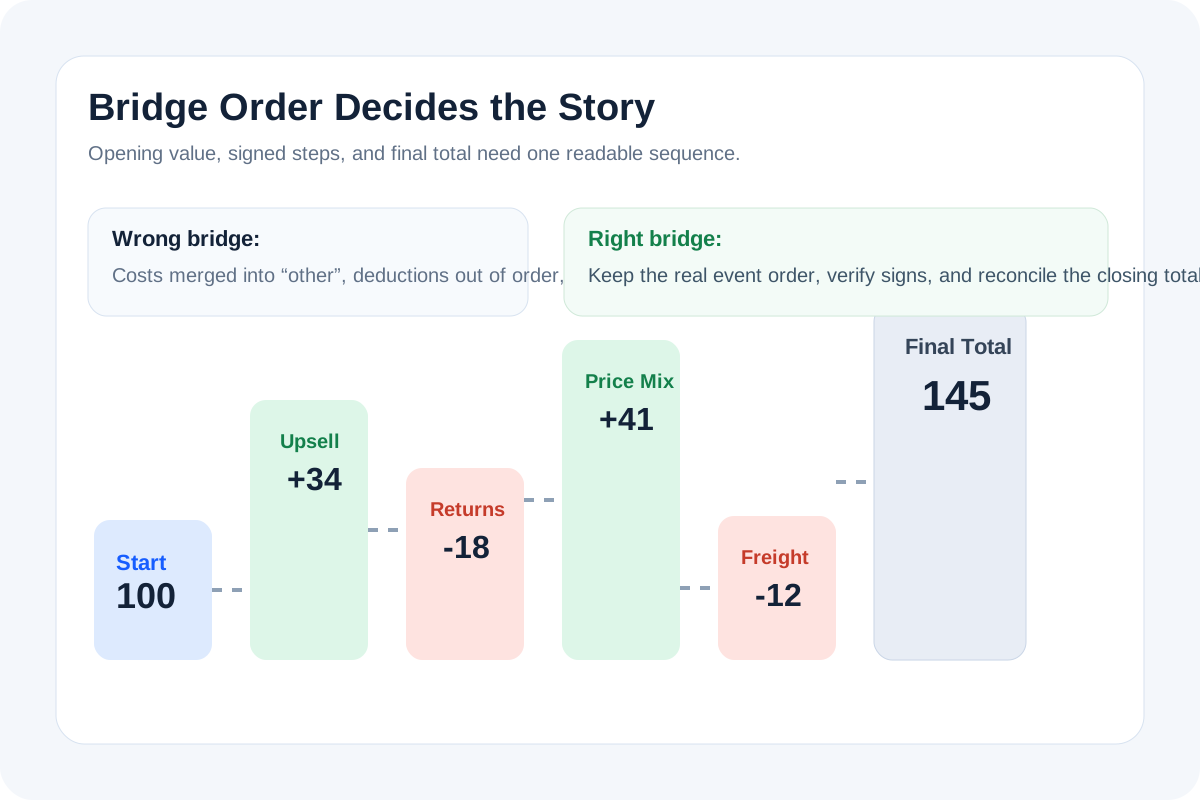
A waterfall chart becomes misleading long before the final number is wrong. The real failure usually sits in the bridge logic: one deduction is shown too early, two drivers are merged into a vague bucket, or a subtotal is treated like an ordinary step. The chart still looks polished, but it explains the movement badly. A technical waterfall workflow keeps the sequence tied to the underlying business event order instead of letting the picture improvise the story.
What the bridge is actually encoding
A waterfall chart is not only a visual. It is an ordered model of change between a starting value and an ending value. Each bar says whether the total moved up or down, by how much, and in what narrative position. If the steps are in the wrong order, the audience may still see the same final total while learning the wrong causal path.
Where technical bridge mistakes usually start
- A source sheet mixes operating changes, one-off adjustments, and the final subtotal in one flat list.
- A negative value is entered as a positive bar because the label implies a cost but the sign was not verified.
- A chart lumps several drivers into other before anyone tests whether the audience can still explain the movement afterward.
- The opening value and closing value are correct, but the intermediate sequence reflects presentation convenience rather than the real business order.
A safer build sequence
- Lock the opening and closing values first so the bridge has clear anchors.
- List every intermediate step in the exact order you would explain it aloud to a stakeholder.
- Check the sign of each step before export so additions and deductions move the total in the intended direction.
- Split vague buckets if they hide the one driver the audience actually needs to understand.
- Confirm that the final total reconciles with the opening value plus the full step sequence before you share the chart.
Why this matters more than visual polish
Most readers will trust a finished chart faster than they trust a table. That makes structural mistakes more dangerous, not less. When the bridge is technically sound, the chart reduces explanation time. When it is not, it gives the meeting a clean-looking fiction.
Related UtilFlow moves
If the source still lives in rough rows, clean it in CSV Chart or Table Generator first so the step sequence is easier to inspect. If the audience cares more about category mix than sequential movement, switch to Stacked Bar or Bar Chart rather than forcing a bridge onto the wrong question.
FAQ
What is the most important technical choice in a waterfall chart?
The most important choice is the step sequence, because it controls how the audience interprets the movement from the opening value to the final total.
Why can a waterfall chart be misleading even when the ending total is right?
Because the intermediate steps may be signed, grouped, or ordered in a way that implies the wrong explanation of how that total was reached.
What should I verify before exporting a waterfall chart?
Verify the opening value, closing value, sign direction of each step, step order, and whether the bridge still tells the same story you would give verbally.