How to Build a Waterfall Chart From Budget or Variance Data
Turn starting values, positive changes, negative changes, and a final total into a waterfall chart that explains where the number moved.
Open Waterfall Chart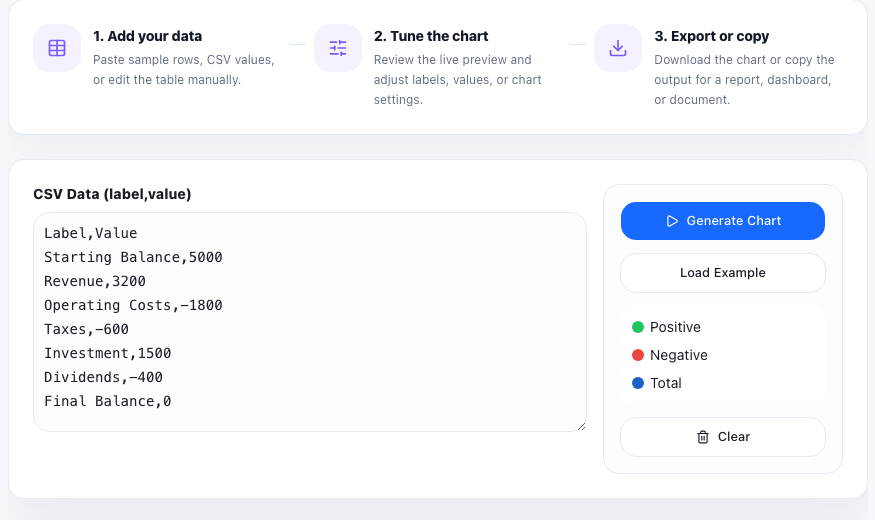
A waterfall chart works when one number changes in visible steps. Instead of showing only the start and end, it shows what pushed the total up, what pulled it down, and where the final value landed.
Start with the right data shape
- Use one starting value such as budget, opening balance, planned revenue, or prior-month total.
- List each positive and negative change as a separate step with a short label.
- End with the final total only after all intermediate changes are entered.
- Keep the sequence in the same order you would explain it verbally in a meeting.
Choose labels that explain the movement
Labels like 'Q1 variance' or 'adjustment' are often too vague. More useful labels say what changed the number: price increase, returns, new signups, churn, discounts, freight cost, or one-time expense. If the label is unclear, the chart will still be technically correct but harder to use.
Check sign direction before exporting
The biggest tutorial mistake is entering decreases as positive values or mixing totals with intermediate steps. Review whether each bar should move the running total upward or downward and confirm that the ending figure matches the source calculation.
Where waterfall charts fit best
This format is especially useful for budget variance reviews, profit bridge discussions, revenue walk-throughs, inventory changes, and any status update where stakeholders ask not just what the total is, but what caused it to move.
FAQ
When is a waterfall chart better than a bar chart?
Use a waterfall chart when you need to show how a total changes step by step, not just compare separate categories.
What data makes a waterfall chart confusing?
It becomes confusing when labels are vague, decreases use the wrong sign, or intermediate adjustments and totals are mixed together.
What should I verify before sharing the chart?
Verify the order of steps, the sign of each change, and that the final total matches the underlying spreadsheet or source calculation.