How to Build a Simple Funnel Chart From Stage Counts
Turn stage-by-stage counts into a funnel chart that shows where a signup, sales, or application flow loses people.
Open Funnel Chart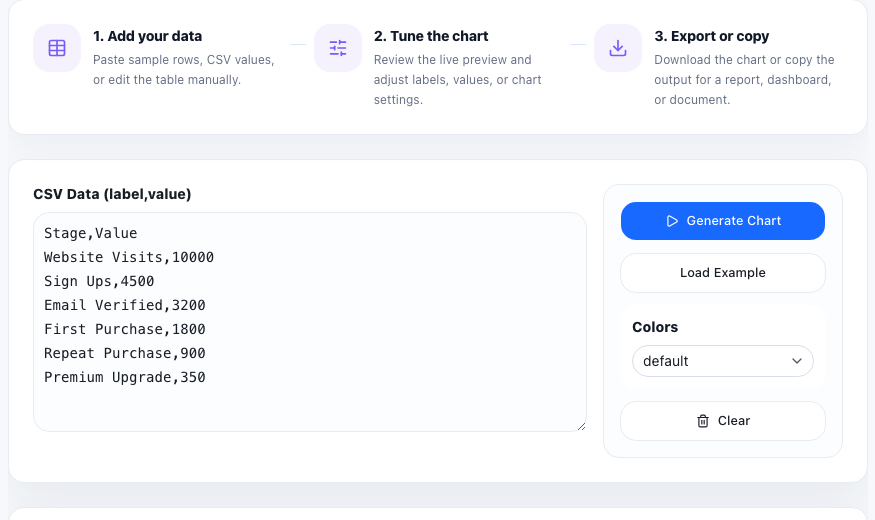
A funnel chart is useful when you already know the counts at each stage and need a quick visual that shows where people, deals, tickets, or applications drop out. It works best for ordered flows where every stage represents a narrower subset of the previous one.
Start with one clear funnel question
Before entering any numbers, decide what the funnel is measuring. A signup funnel, sales pipeline, hiring flow, or support escalation path can all use the same chart shape, but only if the stages belong to one consistent process.
A practical funnel-chart tutorial
- List the stages in the order people actually move through them, such as Visit, Trial, Qualified, Demo, and Closed.
- Use counts from the same date range so one stage is not being compared with another month or quarter.
- Paste short labels and the matching values into the funnel chart tool.
- Check that values generally narrow as the flow moves downward, because a funnel is meant to show filtered progression.
- Preview the chart and rewrite any label that would be unclear to someone outside the team.
What makes a funnel chart misleading
A funnel becomes hard to trust when stages are out of order, when counts come from different systems with different definitions, or when one stage includes people who never entered the previous stage. If your process branches or loops, another chart type may tell the story more honestly.
Where teams use this most
This lightweight chart is useful in weekly growth reviews, sales standups, onboarding audits, and application-volume checks where the point is to spot the biggest drop quickly rather than to build a full BI dashboard.
FAQ
What data do I need for a funnel chart?
You need ordered stage labels and one count for each stage from the same process and time range.
Do funnel chart values always need to decrease?
They usually should if the chart represents a narrowing process. If later stages grow unexpectedly, check the definitions or consider a different chart.
When is a funnel chart better than a bar chart?
Use a funnel chart when the categories represent sequential stages in one flow, not just separate categories being compared side by side.