How to Use Radar Chart in a Practical Online Workflow
Create radar and spider charts. Learn when this tool is useful, what problems it solves, and how to fit it into a practical online workflow.
Open Radar Chart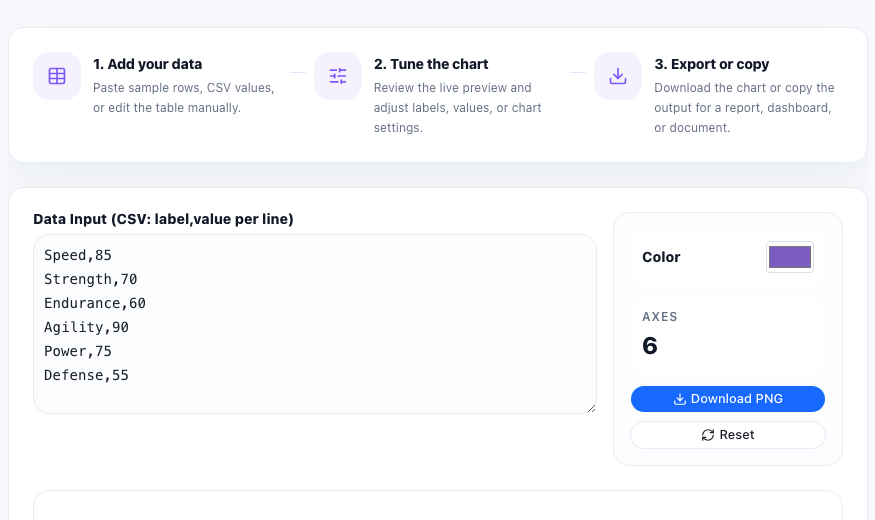
Radar Chart is useful when you are turning CSV data into a quick visual and need a fast way to handle the task without switching into a heavier workflow. Create radar and spider charts for comparing multiple dimensions on the same scale. Use it for skills, product attributes, team comparisons, scorecards, and performance profiles.
The real problem this helps solve
Chart work often starts with messy tabular data, unclear labels, or a need to preview a visual before creating a polished report.
For radar Chart tasks, the important part is not only running the tool. The useful result is a cleaner output that can be used in a report, document, codebase, upload form, message, or review process without creating extra manual work.
A practical workflow
- Add your data: Paste sample rows, CSV values, or edit the table manually.
- Tune the chart: Review the live preview and adjust labels, values, or chart settings.
- Export or copy: Download the chart or copy the output for a report, dashboard, or document.
Technical notes
Browser chart tools parse structured rows into labels and numeric values, then render the result as a visual model that makes patterns easier to compare than raw tables.
Radar charts help compare several variables at once, especially when each axis represents a score, rating, capability, or attribute.
Searches this guide helps answer
- radar chart maker
- spider chart maker
- skills radar chart
- comparison radar chart
Related workflow ideas
This task often connects with Bar Chart Maker, Scatter Plot, CSV Chart Maker, Donut Chart. Use them together when the job needs more than one cleanup, conversion, validation, or export step.
FAQ
When should I use Radar Chart?
Use Radar Chart when you need to create radar and spider charts. It works best when you want a quick online workflow with clear input and output.
What should I check before copying the result?
Check that the input is complete, the selected options match your goal, and the output includes the labels, formatting, or file structure needed for the next step.
Can Radar Chart be part of a larger workflow?
Yes. Many users combine it with related UtilFlow tools when they need to clean, convert, validate, compress, extract, or prepare content before sharing it.